I think so.
First, see if I can backup all the WordPress blog posts on WHUK, and redo the site on there with the right email address this time.
I think so.
First, see if I can backup all the WordPress blog posts on WHUK, and redo the site on there with the right email address this time.
Well, this is a picture from the 2012 festival, and the campers had my sympathy. But I think the modern festivals are not a patch on the old ones...

Judas Jump: A heavy progressive rock band featuring Andy Bown and Henry Spinetti of The Herd and Allan Jones of Amen Corner.
Kathy Smith: A Californian singer-songwriter, signed to Richie Havens' label, "Stormy Forest", was well-received.
Rosalie Sorrels: Another folk musician, accompanied by...
David Bromberg: Bromberg was not on the bill, but he performed a popular set.
Redbone: Native American pop/rock outfit.I have no memory of those performers, and have not spotted any recordings of them that I can buy.
Kris Kristofferson: Performed a controversial set. Due to poor sound, the audience was unable to hear his set, and it appeared that they were jeering him. He was eventually booed off the stage.This guy turned up at a Rock Festival and played Country and Western. Fair enough, some variety is needed, but he played it very, very badly. We damned well were booing him, because we could hear him.
Mighty Baby: psychedelic rock band.Mighty Baby were a welcome relief from the Kristofferson performance. I met their drummer in Southsea once, and he was a really nice bloke.
Gary Farr: The brother of Rikki Farr [the festival compere], Gary had been the front man of the T-Bones, an R&B combo that featured Keith Emerson on keyboards. By this time, he had become a solo artist, and his only album, "Strange Fruit", for CBS Records, had been released in 1970.
Supertramp: Their debut album had just been released a month prior to the festival.
Andy Roberts' Everyone: [Wikipedia says nothing about this.]
Howl: Scottish hard-rock band formerly known as "The Stoics", featuring Frankie Miller.
Black Widow: a British band that wrote songs about Satan worship in their 1970 debut LP, "Sacrifice".
The Groundhogs: English blues rockers. Very good, too.And finally we come to a performance that is actually available on CD! Terry Reid was good. I sort of remember quite lot of the music on the CD of his set when I play it.
Terry Reid: The English singer performed with David Lindley. The set was released on CD in 2004.
Gilberto Gil: Brazilian musician, playing to a frenzied audience.I am not at all certain that I was frenzied...
Fairfield Parlour: They had recorded a single called "Let The World Wash In", released under the name "I Luv Wight", which they hoped would become the festival's theme song. They had also previously recorded as The Kaleidoscope.But "Amazing Grace" was played every day, at startup, and that's the one we remember.
Arrival: Their set, which included a Leonard Cohen cover, was well received.
Lighthouse: This popular Canadian act performed two sets at the festival.
The Taste album, "Live at the Isle of Wight" is splendid, with Rory Gallagher playing in his usual amazing guitar style.
Taste: Legendary guitarist Rory Gallagher had a blues trio from 1968 to 1970. This was one of their final shows, which was filmed and recorded. An album, Live at the Isle of Wight, was released of their set in 1971.
Tony Joe White's splendid set is out there on CD, but very expensive. The tracks in question are half of one CD of a four CD set. Great drumming from Cozy Powell, too.
Tony Joe White: Performed hits including Polk Salad Annie; his drummer was Cozy Powell. Tony Joe's entire set was released in 2006 on "Swamp Music" a Rhino Handmade collection of his Monument recordings.
Chicago: Their set, including "25 or 6 to 4," "Beginnings" and "I'm a Man," was a highlight of the night.
Family: Mysterious absence of information on Wikipedia...
Procol Harum: Frontman Gary Brooker commented that it was a cold night.
Voices of East Harlem: Their set received several standing ovations. Not actually a band, but a bunch of singing school children from Harlem. They had one studio album.There are apparently a couple of tracks from Cactus on a compilation LP, but I have not been able to find it, and have nothing to play it on.
Cactus: Two songs from their set were featured on the LP The First Great Rock Festivals Of The Seventies.
Mungo Jerry were there but decided not to play.It was way past their bedtime, apparently.
John Sebastian: Performed an 80-minute set, during which former Lovin' Spoonful guitarist Zal Yanovsky, made a surprise guest appearance.
Shawn Phillips: American folk musician performed an impromptu solo set following John Sebastian.
Lighthouse (second set)
Joni Mitchell: Played a controversial set; Following her performance of "Woodstock", a hippie named Yogi Joe interrupted her set to make a speech about Desolation Row. [...] After the crowd quieted down, Mitchell closed her set with "Big Yellow Taxi". [1]
Tiny Tim: His rendition of "There'll Always Be an England" can be seen in the film Message to Love. [2]
Miles Davis: A DVD of his complete set was released in 2004. [3]
Ten Years After: British blues rockers performing what was basically a reproduction of their famous Woodstock set. Highlights included "I'm Going Home" and "I Can't Keep From Crying Sometimes," which was featured in "Message to Love". [4]
Emerson, Lake & Palmer: This was their second gig. "Pictures at an Exhibition", which featured the Moog synthesizer was the centerpiece of their historic set. Commercially released as "Emerson, Lake and Palmer Live at the Isle of Wight Festival 1970" in 1997. [5]
The Doors: Their set was shrouded in darkness due to Jim Morrison's unwillingness to have movie spotlights on the band. Their performances of "The End" and "When the Music's Over" are featured in Message to Love. [6]
The Who: Their entire set, including the rock opera Tommy, was released in 1996 on CD (Live at the Isle of Wight Festival 1970). [...] [7]
Sly & the Family Stone: The showstoppers of Woodstock performed to a tired audience on the early morning of Sunday. However, the audience woke up for spirited renditions of "I Want to Take You Higher", "Dance to the Music" and "Thank You (Falettinme Be Mice Elf Agin)", which featured Sly on guitar. Prior to their encore, another political militant decided it was time to make a speech, and the booing audience started to throw beer cans onto the stage. Freddie Stone was hit by a flying can and an angry Sly decided to skip the encore. He did promise a second appearance, but this never occurred. [7]
Melanie: This Woodstock veteran played a well-received set as the sun rose. Prior to her set, Keith Moon of The Who offered her some moral support and encouragement. Not until afterwards did Melanie realize who he was. Her performance of her own song, 'What Have They Done to my Song Ma' was included in a 2010 French documentary, spanning the 1970 and 2010 I.O.W. festivals, called 'From Wight to Wight' and first shown on TV station ARTE, on 30/07/2010. [8][1] John Sebastian, Shawn Philips and Lighthouse were not especially memorable, except that I remember thinking Sebastian and Yanovsky's lovey-dovey reunion, and the "borrowing a guitar from the audience" schtick were rather contrived. And all the stuff about what happened while Joni Mitchell was on seemed remote to those who were a hundred yards from the stage. Frankly, a lot of the stuff you read about all the angst going on at this festival was a surprise to those of us who were there. I have the recording of "Big Yellow Taxi"; it's not really rock, I suppose, but a good song.

Good News: American acoustic duo. [1]
Kris Kristofferson (Second set) [2]
Ralph McTell: Despite an enthusiastic reception from the audience, he did not play an encore, and the stage was cleared for Donovan. [3]
Heaven: English answer to Chicago and Blood Sweat & Tears [4]
Free: Their set list consisted of "Ride on a Pony", "Mr. Big", "Woman", "The Stealer", "Be My Friend", "Fire & Water", "I'm a Mover", "The Hunter", their classic hit "All Right Now", and concluded with a cover of Robert Johnson's "Crossroads". [5]
Donovan: He first performed an acoustic set, and then an electric set with his band Open Road. [6]
Pentangle: British folk combo. A German woman interrupted their set to deliver a political message to the audience. [7]
The Moody Blues: A popular British act and veteran of the 1969 festival. Their rendition of "Nights in White Satin" can be seen in Message to Love : Their set is featured on Threshold of A Dream Live at the Isle of Wight 1970. [8]
Jethro Tull: Their set is featured on Nothing Is Easy: Live at the Isle of Wight 1970. During Sunday morning the audience were entertained by a rehearsal/sound-check by Jethro Tull. [9]
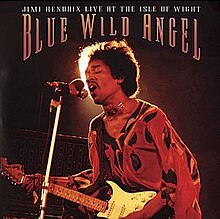
Jimi Hendrix: The star of the festival performed in the early hours of 31 August with Mitch Mitchell on drums and Billy Cox on bass. His set has been released on CD and video in various forms. In the beginning Hendrix had technical problems, which at one point during "Machine Gun" involved the security's radio signal interfering with his amp's output. David Gilmour from Pink Floyd has confirmed that he watched this Hendrix concert.[10]
Joan Baez: Her version of "Let It Be" can be seen in the film Message to Love. [11]
At this point, we left to get the ferry, as we had to be in college, in Liverpool the next morning. We did it, but I have no idea how...
Leonard Cohen: Backed by his band The Army, his tune "Suzanne" can be seen in the film Message to Love. In October 2009 audio and video (both DVD and Blu-ray) recording of his set, Live at the Isle of Wight 1970 was released. [12][1] I don't remember anything about Good News.
Richie Havens: The musician who opened Woodstock closed this festival with a set during the morning of 31 August. As Havens performed his version of "Here Comes the Sun", a cloudy dawn broke, so he changed the lyrics to "Here Comes the Dawn". Havens' set, which is available as an audience recording, also included "Maggie's Farm" by Bob Dylan, "Freedom", "Minstrel from Gault" and the Hare Krishna mantra. [13]